FRONTWARD: Fronts for marine Wildlife Assessment for Renewable Developments
Project Focus

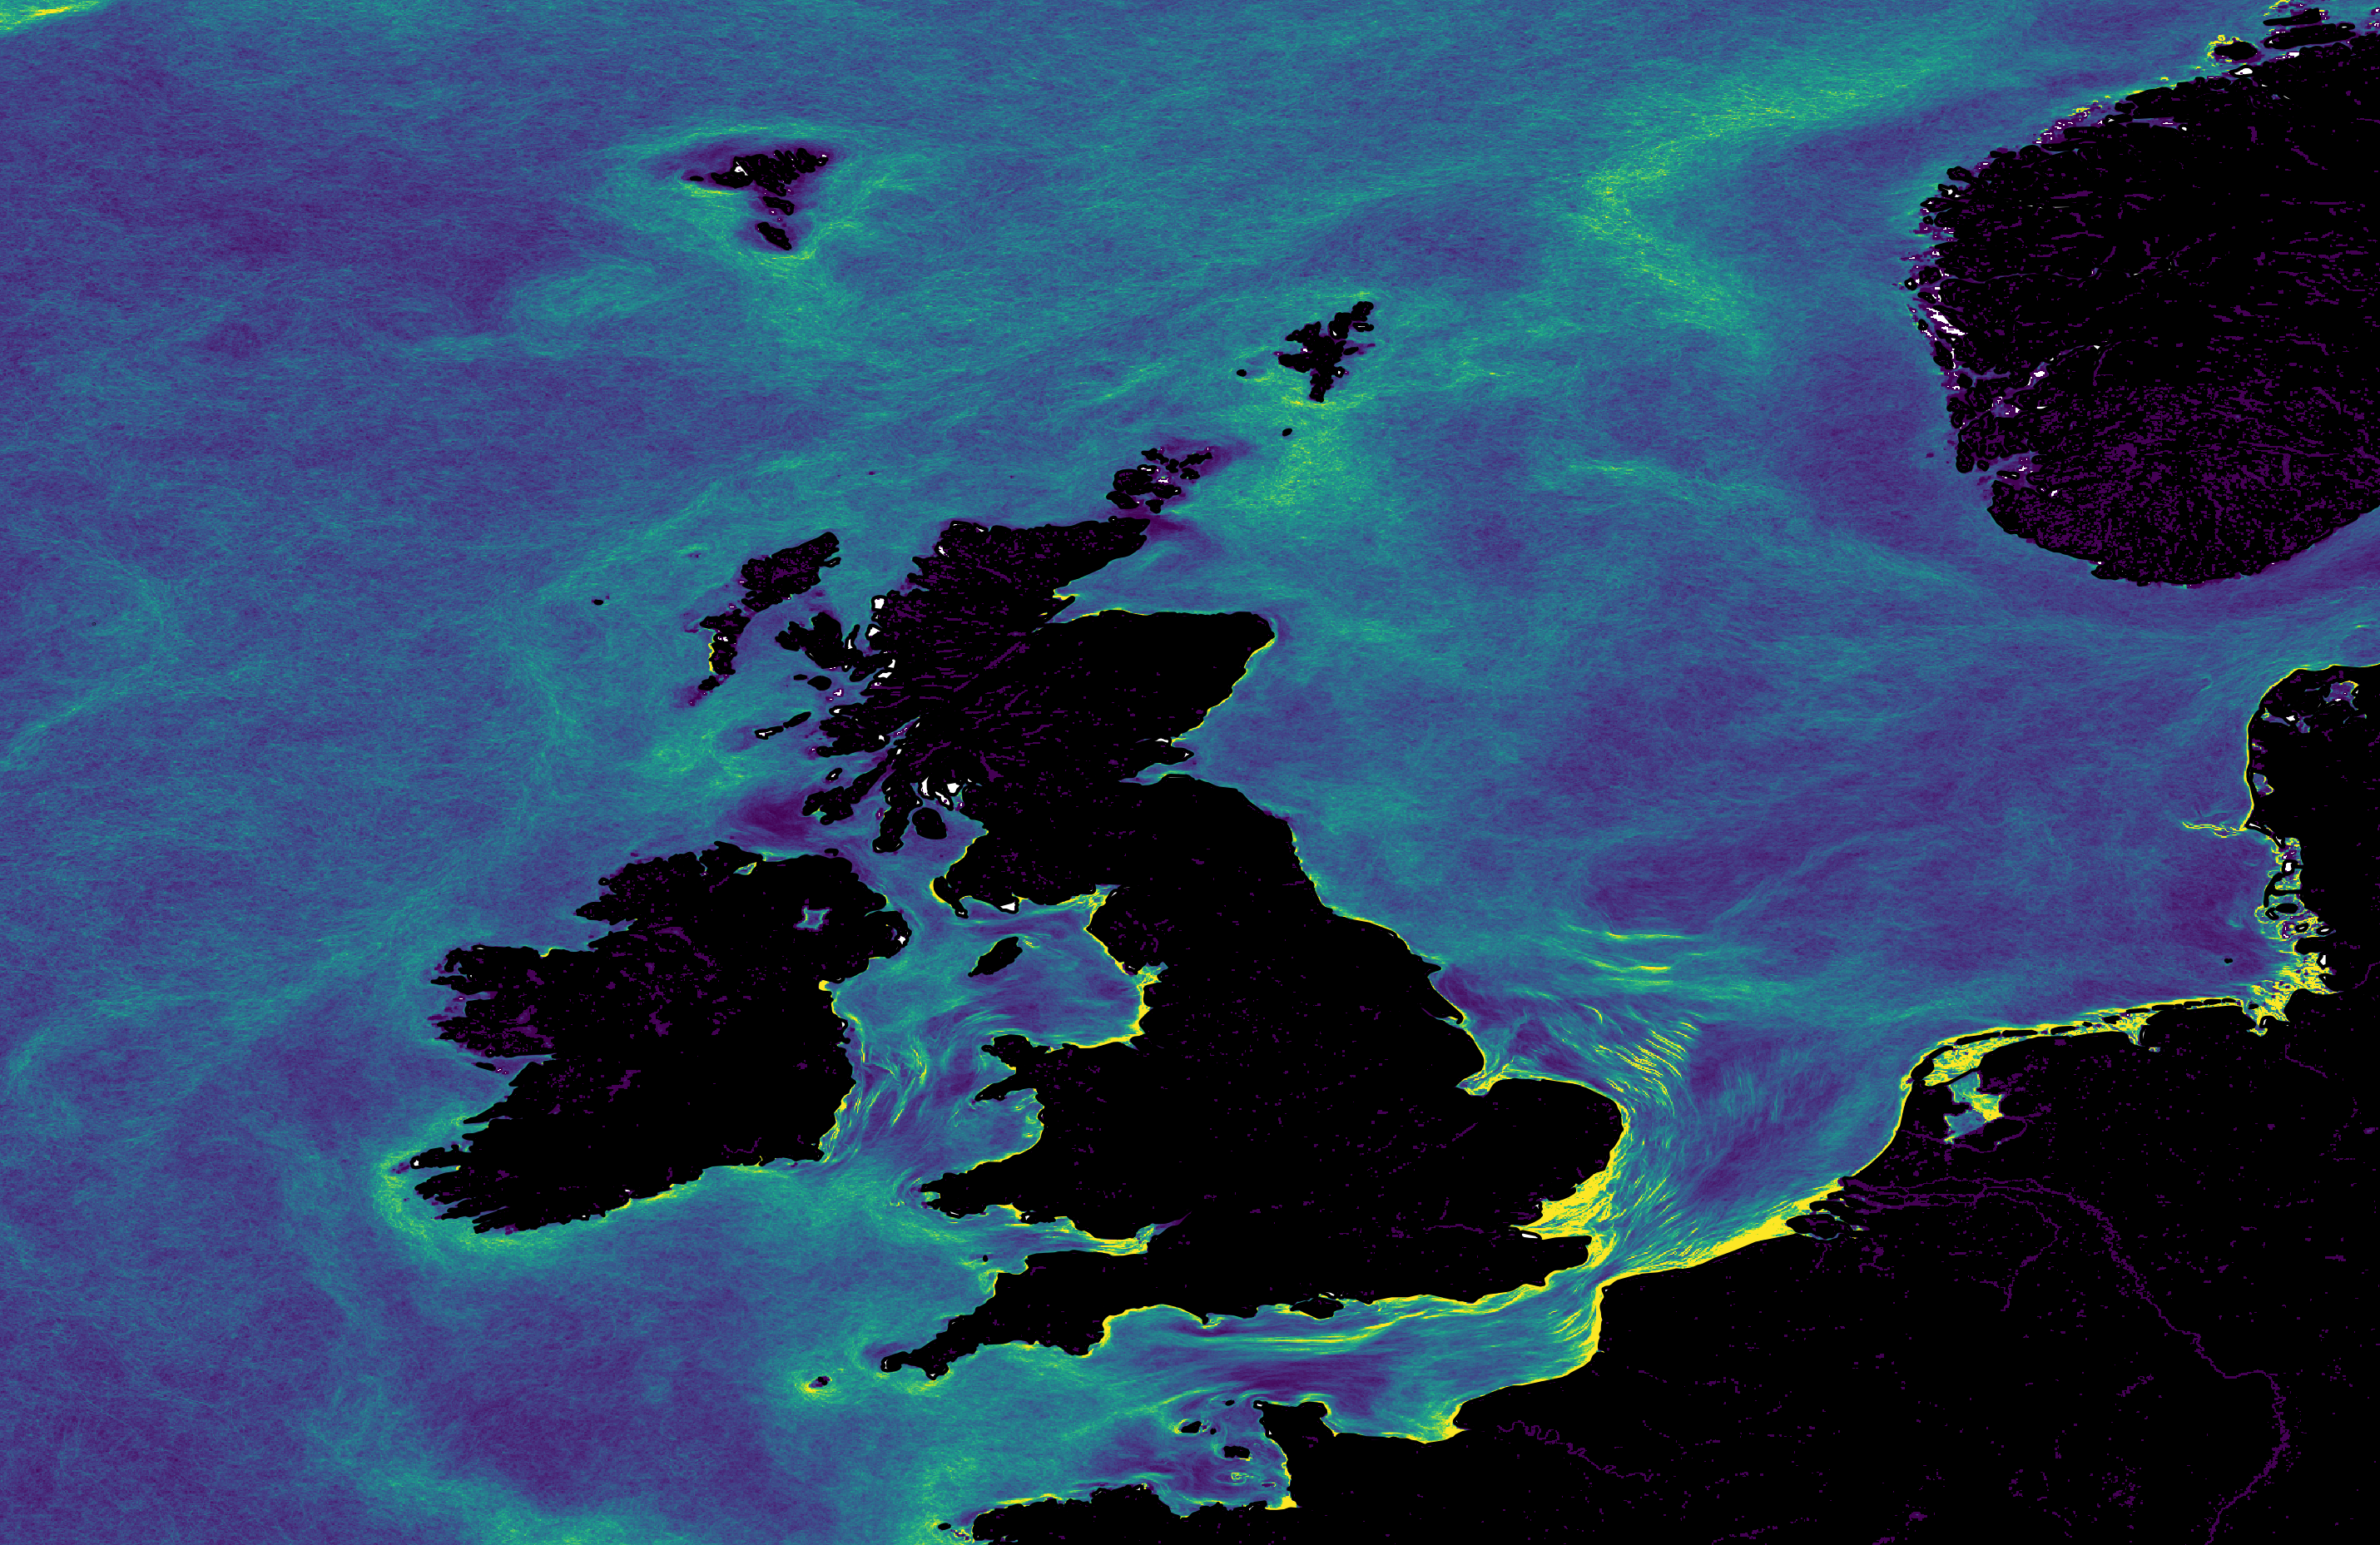
This project focuses on the development of spatial analysis aiming to increase our understanding of the level of spatial and temporal variability in the locations and persistence of ocean fronts, the interface zones between distinct water masses, both for sea-surface temperature and surface colour (chlorophyll-a is a proxy for surface abundance of plankton) and surface detection of internal waves.
The project also investigated whether there were relationships between ocean fronts, internal waves and detectable biodiversity hotspots for highly mobile marine animals (fish, seabirds and marine mammals). A summary and range of limitations and considerations of this new spatial information has been provided to assist those using this data in the future planning of marine sectors, e.g., offshore renewable energy.
This project has provided new spatial information that will drive impact and value for spatial modelling, and that could be used in future offshore wind scenarios and other renewable energy analysis, derisk consenting, and support nature recovery.
Location:
UK Exclusive Economic Zone (UK EEZ)
Timeline:
May 2024 - March 2025

Deliverables

Intended Impacts
Partner Organisations:
- Plymouth Marine Lab (PML)
- University of Aberdeen (UoA)
- Bangor University (UoB)
Funding Organisations:
- The Crown Estate
Key findings:
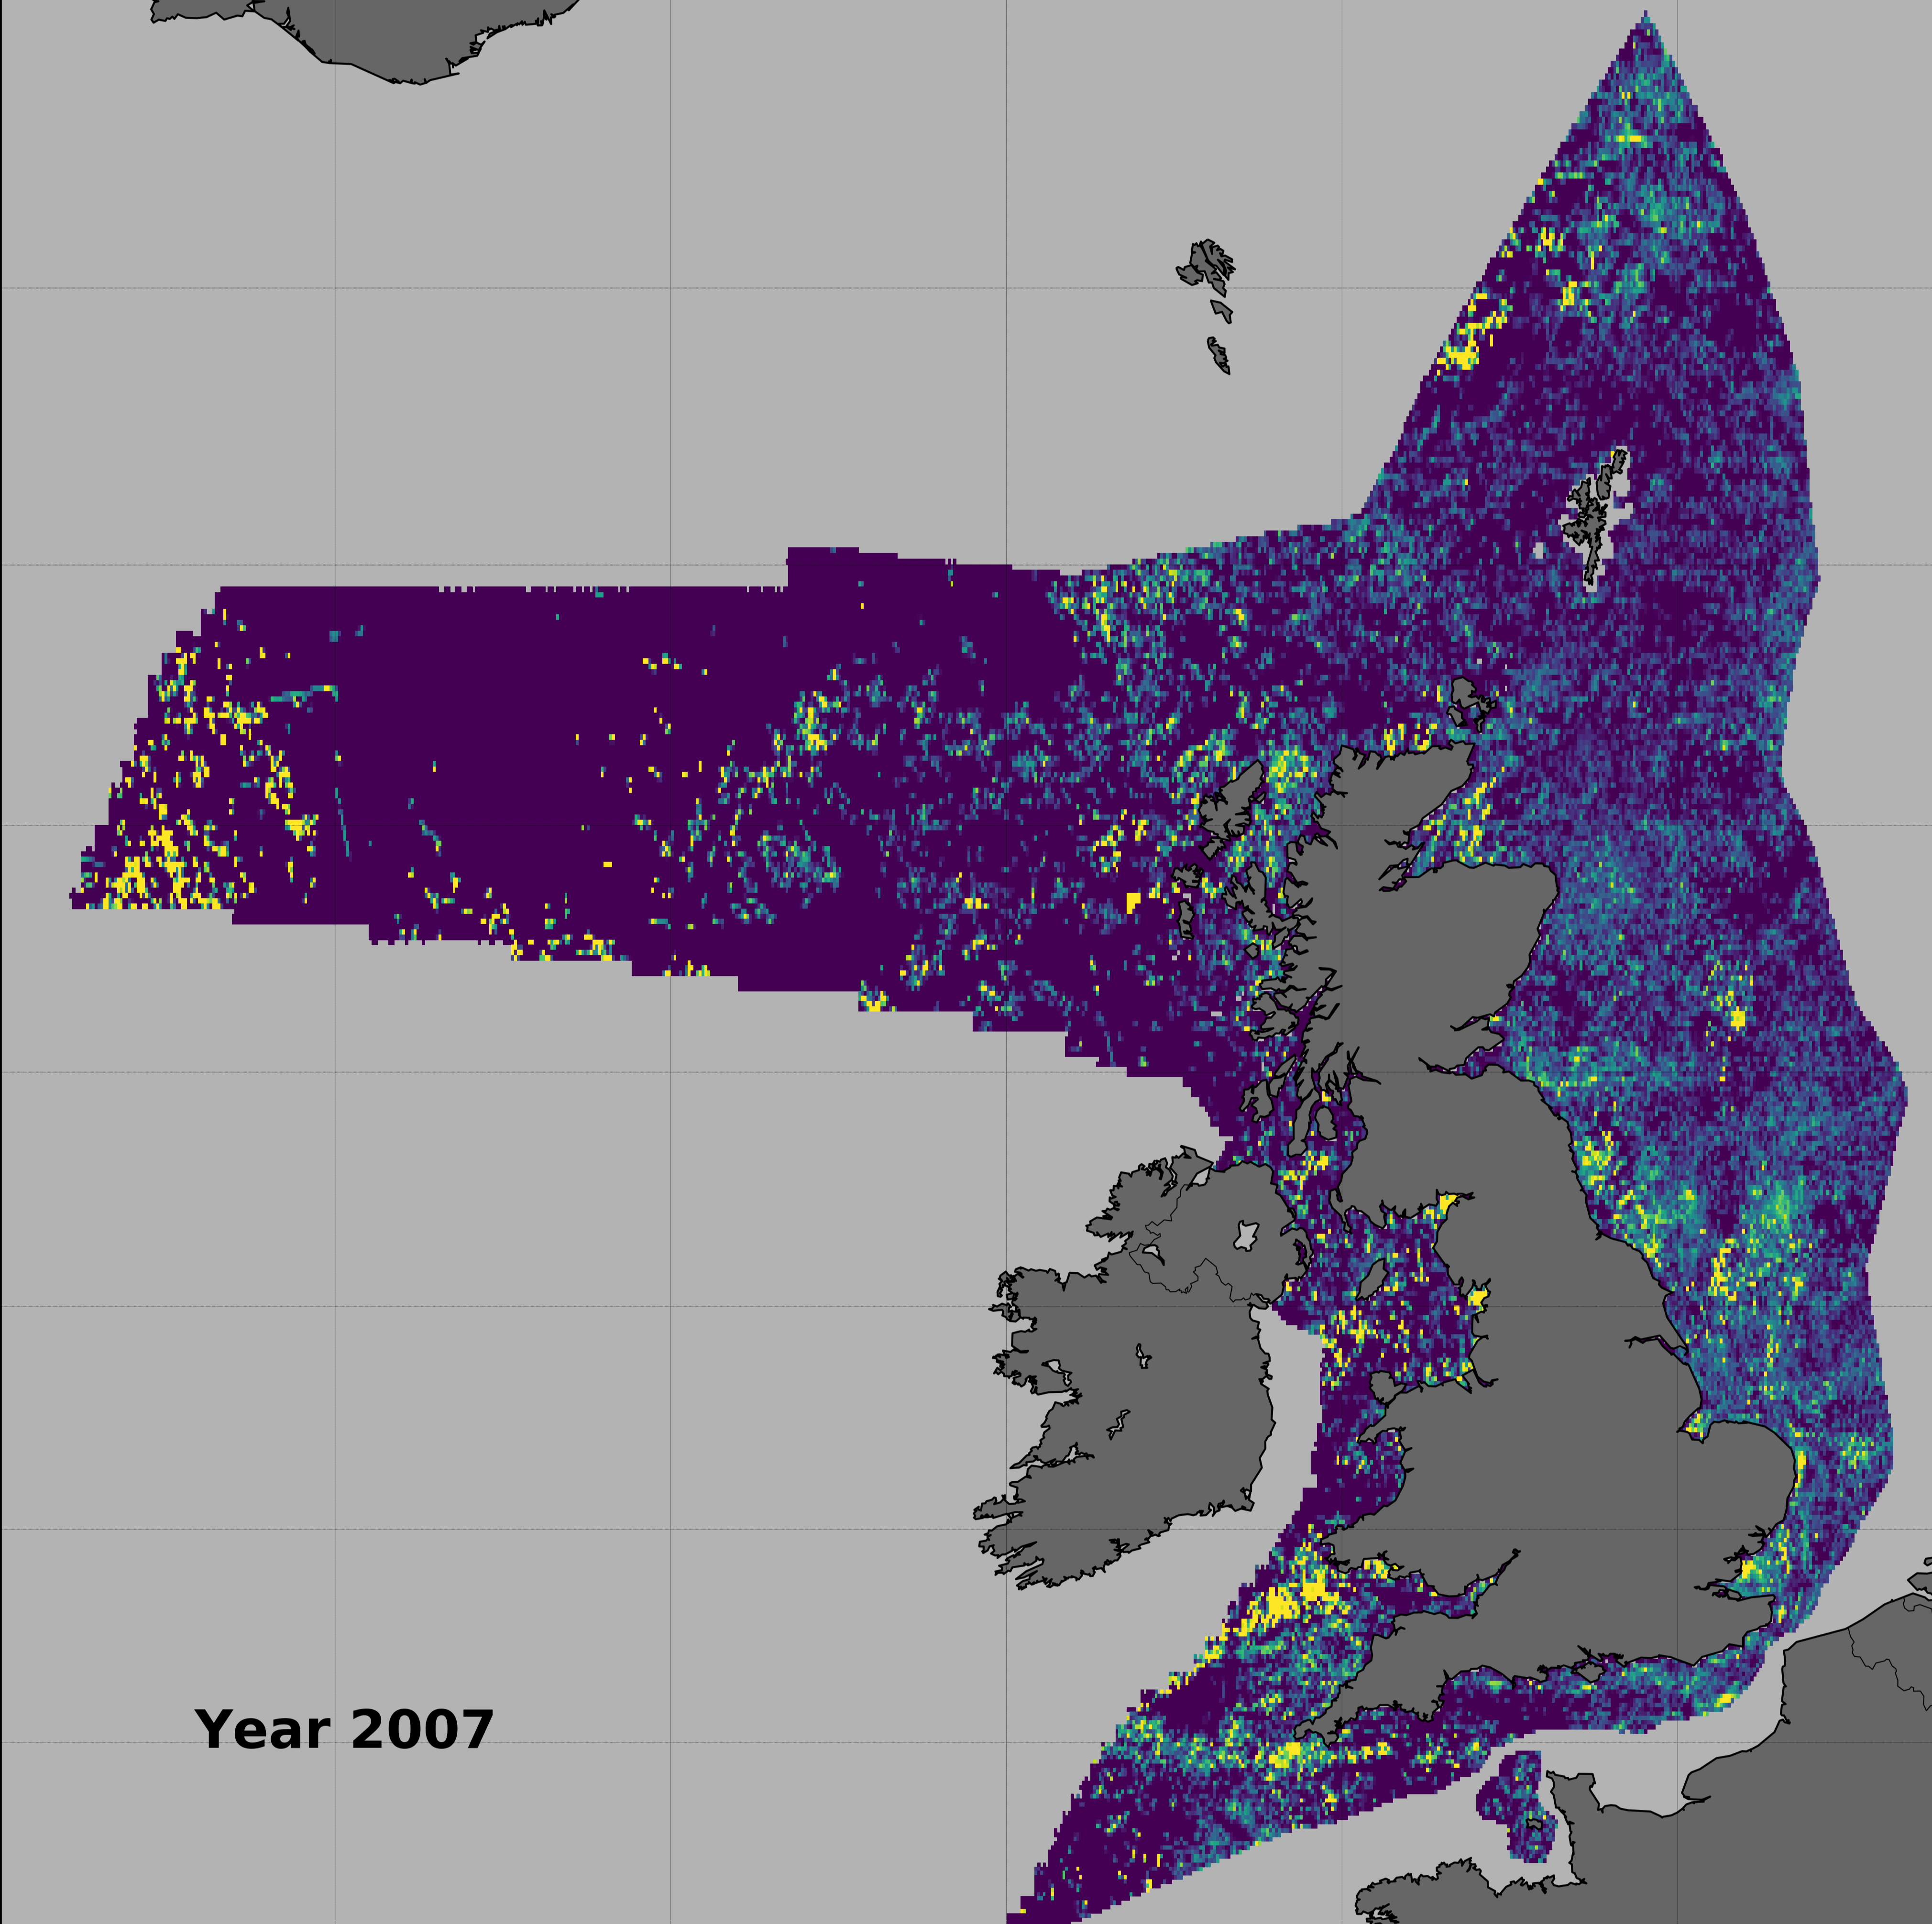
1. Mapping frontal and highly-mobile species biodiversity hotspots: The predicted biodiversity map (the residuals from expected, given the effort) highlights areas where higher number of species are likely to be detected, based on a set number (53) of common species of fish, seabirds and marine mammals. The areas of greater biodiversity are mostly concentrated in the northern North Sea, with few other areas more coastal in the south and west. The relationships between frontal metrics and detected biodiversity are much stronger in the seasonal (quarterly) analysis than over a 6-month period and highlight that although ‘location’ explained a high proportion of variance, the sea-surface temperature (SST) front gradient and Chlorophyll-a (Chl-a) front persistence, in particular, are good spatial predictors of higher biodiversity values – especially during the summer months. However, it should be noted that the summer season had the most animal data, so other seasons may also have strong relationships, but not enough survey data (even over 20 years) was collected to fully identify those relationships. We recommend the appreciation of the large changes in the location of detected biodiversity across the seasons before using any one of the four seasonal maps for thermal and Chl-a fronts, internal waves to predict locations of detected biodiversity hotspots.
2. Understanding front dynamics: The monthly long-term averages of thermal/Chl-a fronts provide insights into the seasonal nature of fronts and their influence on marine biodiversity; in addition, the dynamic front metric evaluates movement on daily/weekly timescales. We have advanced understanding of the short and long-term factors that drive variability in these fronts: wind, tides, NAO, etc., and compared locations of thermal fronts, Chl-a fronts and internal waves. This analysis highlighted that other types of fronts (not just tidal-mixing fronts), and weaker fronts, may also be associated with high biodiversity such as in NE Scotland: these differences need to be investigated. It is critical to understand the significance of seasonal changes in both fronts and detected biodiversity, and hence that simply averaging data across the whole year obscures the spatial relationships.
3. Engaging with stakeholders: The evidence base provided by FRONTWARD can facilitate discussions with stakeholders, including conservationists, industry representatives, and regulatory bodies. Having a robust understanding of the ecological context allows for more collaborative planning efforts and can foster community support for offshore renewable energy developments. We recommend an iterative process where the FRONTWARD team learn about potential usage of the data layers, so can then advise on that action in consideration of limitations of the data.